Empowering Business Success via Data Intelligence

Expert data solutions for finance and risk analysis.

Transforming data into actionable business insights.

User-friendly dashboards for effective decision-making.

Comprehensive data mining for strategic growth.

A laptop displaying a financial dashboard with various stock market graphs and data. The screen shows different stock indices and their performance, including line charts and a bar chart for market overview. The laptop is placed on a light-colored table, and a gray sofa is visible in the background.
A person is interacting with a smartphone displaying financial data, while a laptop in the background shows various stock market indices. The hand is using a finger to navigate the smartphone. Both screens are filled with numbers and graphs related to market information, with the laptop displaying line charts.
Detailed financial data presented in a tabular format, including company names such as Dow Inc., Caterpillar, and 3M. Various metrics and statistics are displayed, along with changes in value highlighted in green and red.

Empowering Business Through Data Intelligence

At Dataryz, we specialize in data intelligence and finance, providing tailored solutions for business insights and risk analysis across Europe and beyond.

A newspaper page focused on financial information, including stock market data, recent issues, rates, major price changes, and investment fund details. Columns of numbers are interspersed with headings and small charts, printed on plain paper with a slightly off-white background.

150+

15

Trusted by Leaders

Proven Expertise

Data Intelligence Solutions

Empowering businesses with insights for effective decision-making and risk management across industries.

A laptop displays a detailed financial chart with lines showing data trends. In the background, a person is partially visible, wearing a dark shirt with the words 'most valuable' and some logos printed on it. The setting appears to be a modern workspace.
Data Mining Services

Transforming raw data into actionable insights for your organization’s growth and efficiency.

Dashboard Reporting

User-friendly dashboards that visualize key metrics for informed business steering and analysis.

Business Partnering

Collaborative services that enhance strategic decision-making across all functions within your organization.

Dataryz transformed our data insights, enhancing decision-making and risk analysis across our organization effectively.

John Doe

Hands typing on a laptop keyboard with a screen displaying financial graphs and stock market data. Multiple charts and numbers are visible, indicating online trading or financial analysis.
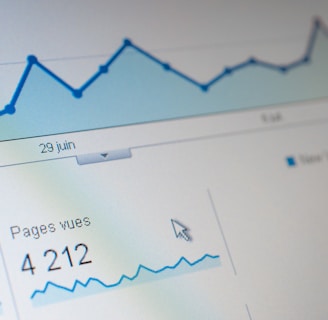
A computer screen displaying a data analytics dashboard with graphs and charts. A blue line graph shows fluctuations in data over time, and a section highlights the number of page views. A pie chart is partially visible, indicating a breakdown of different data elements.

★★★★★

Data Insights

Empowering businesses with intelligence and risk analysis solutions.

A laptop with an open screen displaying dashboard analytics featuring charts, graphs, and numerical data related to sales and subscriptions. The interface is predominantly dark-themed with sections highlighting key performance metrics. The device shown is a MacBook Pro, indicated by the keyboard layout and branding.
Business Intelligence

Transforming data into actionable business insights for success.

An interior space with a high ceiling featuring a large electronic board displaying various financial data and numbers. There is modern seating with red and white chairs, and a person is walking through the room.
A board displays various financial numbers, including positive and negative values with decimal points. The numbers are aligned in columns, suggesting a stock market or financial data context. The overall scene conveys a sense of an analytic or financial environment.
A laptop and smartphone are placed on a wooden table. Both devices display financial charts and data, suggesting involvement in stock trading or market analysis. The setting appears to be indoors with natural light coming through a window.
Risk Analysis

Comprehensive solutions for effective risk management and decision-making.